We just came across this funny infographic depicting how Android, iPhone & Blackberry users see each other. Infographic created by C-Section Comics. Enjoy!

(Click Image to Enlarge)
9151 Hits
We just came across this funny infographic depicting how Android, iPhone & Blackberry users see each other. Infographic created by C-Section Comics. Enjoy!
(Click Image to Enlarge)
PHP, Python and Ruby are three of today's most popular, versatile & marketable computer programming languages, powering mega-sites like Facebook, Twitter, YouTube and Google.
Which language should you learn to land your next job? Which code is the best fit for your next project? Determine which of these red-hot programming languages reigns supreme in this comprehensive side-by-side comparison from acclaimed video education portal, Udemy.com.
|
|
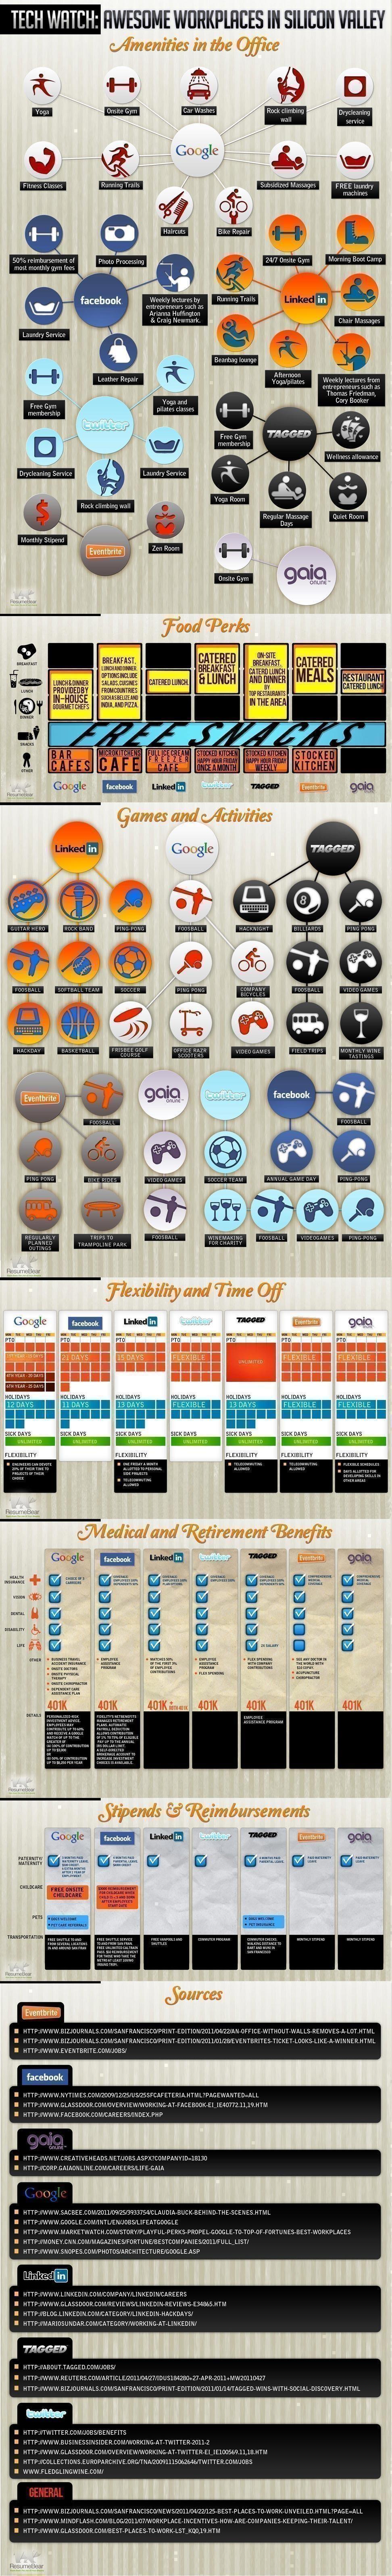
Are you a new or established IT pro looking for work? Like me, do you wonder about the corporate culture and employee perks at Silicon Valley tech giants like Google, Facebook, Twitter and LinkedIn? What about hot startups like Eventbrite, Gaia and Tagged?
Silicon Valley's best and brightest believe that enhanced convenience and a better quality of life for employees has a significant positive impact on productivity, time spent at work, and the all mighty bottom-line. Perks include in-house spas & fitness centers, catered gourmet meals and happy hour, world-class pension and vacation packages, guest lectures from renowned experts and more.
View "Employee Perks in Silicon Valley" Infographic
Check out this infographic for a stunning visual representation of employee perks at some of the best and brightest tech organizations and up-and-coming social media startups in the Valley.
Infographic courtesy of ResumeBear.
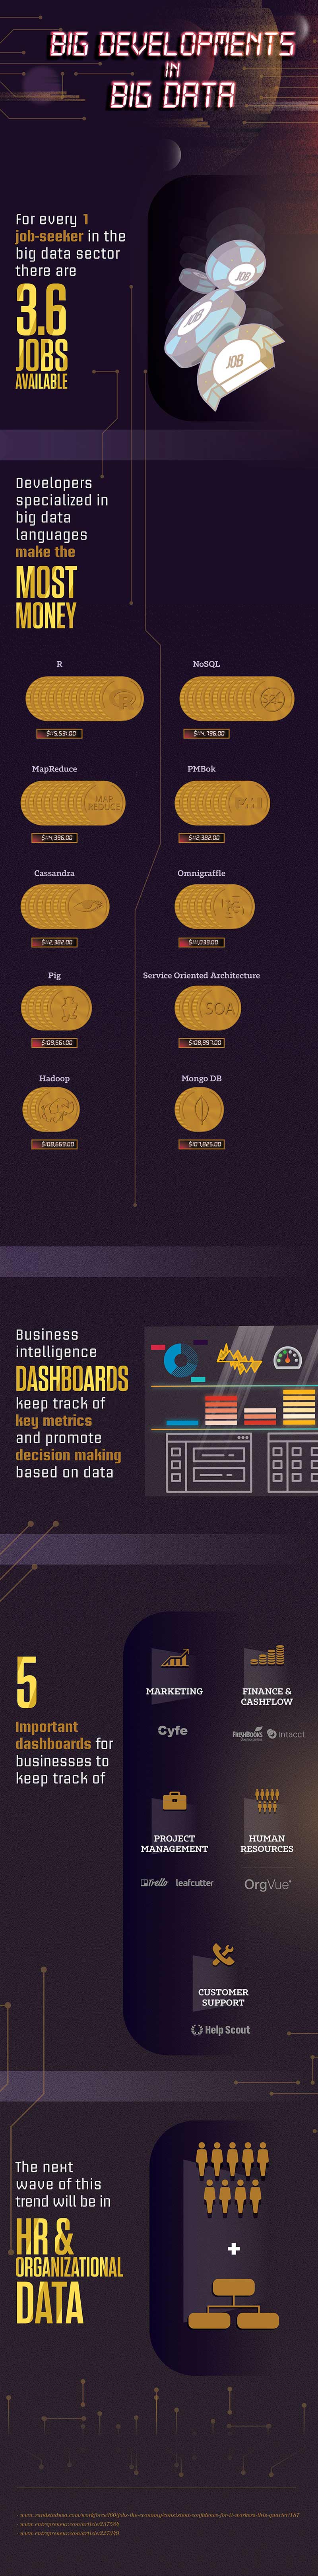
It's hard to deny the fact that "big data" is a ubiquitous buzzword today, and every now and again someone suggests that it's just a passing fad. The fact of the matter is that, while this trend may be experiencing some hype now and will likely eventually plateau (in the distant future), it's going to be a major player from here on in no matter how you slice it. This is because the insight brought forth from analyses of vast quantities of relevant data eliminates assumption and guesswork from the business decision-making process. In large businesses especially, this directly equates to mitigated risk, colossal savings and accelerated growth.
Data from the staffing industry indicates that people aren't just talking about big data; medium and large businesses are spending a great deal on — and exhibiting a lot of interest in — the scouting and hiring of data scientists and developers in the big data space.
The demand speaks for itself: for every one developer looking for a job in big data there are 3.6 job postings available in the United States. Additionally, as of 2014, developers who work with big data languages are the highest paid in the space. R, the statistical analysis programming language tops the list with an average salary over $115,000. Other languages and frameworks designed for dealing with large data sets, such as NOSQL, Apache Hadoop and MapReduce, boast six-figure salaries as well.
Even small businesses reap benefits from big data: although they don't often have the need to substantiate hiring in-house big data developers, they gain an advantage through externally managed analytical dashboards that help them visualize data and spot trends that can influence smarter businesses decisions.
The bottom line is that big data isn't simply an over-hyped term in the tech space and business world. The infatuation with big data is supported with fiscal interest in this new field because of the marked difference it's already making for SMBs and enterprises, and the vast potential it has to impact the way do business going forward. Take a look this infographic to see some of these trends visualized:
Earlier this week, Global Knowledge and TechRepublic published their highly anticipated 2012 IT Salary and Skills Report. Over 9,500 IT professionals completed this year's salary survey and questionnaire. Explore this infographic for the 2012 salary report's key findings, including wage comparisons by IT certification, job function, education, industry and geographic region.
|
|
![]()
SNHU provides affordable online technology degrees respected by employers and universities nationwide.
Featured Online Degrees:

